State of the Art and Science
Jan 2013
Avoiding misunderstanding of health risk and benefit communications is a major challenge in medicine and public health [1]. Everyone is capable of reading or hearing every word presented, understanding each one, and yet grasping nothing of the meaning of the message [2]. Thus, it is critical that health messages are designed with an understanding of how people process health information and consequently make medical decisions.
Here, we describe some evidence-based recommendations for communicating about health risks. In doing so, we describe how people—even expert physicians—can misinterpret test results and misjudge probabilities of illness or other outcome [3]. We also consider theory-driven interventions that reduce these errors.
Don’t stop at the numbers. Consider the example of consenting to a surgical procedure (e.g., carotid endarterectomy) that carries with it a 2 percent chance of life-threatening complications [4]. A patient who consented to this procedure and then later recalled a 0 percent risk of complication would be reflecting greater verbatim accuracy than a patient who recalled 10 percent risk of complication, although the former represents a fundamental misunderstanding of the risks involved in the procedure. This misunderstanding is a demonstration of a failure to get the gist of the message, that there is some risk involved. Compared to the patient who recalled a 10 percent risk of complication—who understands that there is a surgical risk—the patient who recalls no risk is unable to give a truly informed consent.
The example illustrates that getting the gist is the essential element of informed consent. This is critical because gist representations of information—vague, qualitative representations that capture the meaning—are relied on in reasoning and decision making, in contrast to representations of verbatim facts that do not affect reasoning accuracy [1]. Despite the fact that verbatim and gist representations are understood in parallel, adults tend to rely on gist representations to make health and other decisions. For decades, decision-support tools for patients have been developed to guide decisions for costly and prevalent health problems [5, 6], and many researchers have assumed that providing calculators and emphasizing calculation of numerical values should improve health-related judgments and decisions [7]. However, even those who demonstrate the ability to understand and work with numbers process and decide based on categorical (e.g., good/bad) or ordinal (e.g., high-, medium-, and low-risk) gists.
Give reasons for facts. It is difficult to understand gists when relevant context is unavailable, as is often the case with novice patients (who are not experts concerning their diagnoses). For example, understanding that HIV/AIDS is a virus may help in understanding that, like other STIs that are viral, HIV/AIDS is also incurable. Giving the reasons helps useful information endure in memory beyond just the verbatim facts [8].
Begin with the message in mind. Before communicating risk to a patient, identify the “bottom line” [1]. This can include translating numerical facts into meaningful messages, as well as explaining the reasons behind these messages. Bearing in mind the bottom-line message is also critical when considering the possible effects of framing communications positively or negatively. People tend to be risk-averse when situations are described as gains (e.g., in terms of survival or other benefits), and risk-seeking when situations are described as losses (e.g., in terms of death or other harms). Consequently, communications are more effective when framed as gains if the patient is truly in a gain frame and stands to benefit compared to the status quo (for example, if the goal behavior is health-promoting). Loss frames can be more appropriate if the patient truly stands to lose (if, for example, there is uncertainty and risk of negative outcome such as death or reduction of quality of life) [9].
Use graphs that highlight the gist. Where possible, use graphical presentations of risk and benefit information with patients. Different graphical formats can be used to highlight different relationships. For example, to illustrate a monotonic trend, such as a survival or mortality curve or the effectiveness of a drug over time, line graphs are typically best because the gist of the trend is automatically understood. This is so because patients tend to ignore the numbers in favor of the relationship expressed—that the magnitude is going up or down [1].
These same principles can be applied to other graphs. Stacked bar graphs can be used to demonstrate absolute risks—for example, in comparing the frequencies of a given outcome among the total of those treated—by drawing attention to the denominator (i.e., the total treated, in this case). Simple bar charts work better for conveying relative risk, given that small differences can be highlighted. These emphases should be used for specific purposes. For example, it’s better to use relative risks when the decision is between options with everything else being equal, or to highlight differences between options; absolute risk better conveys the essential meaning that risks do not differ significantly. Fraenkel et al. [10] demonstrated that pie charts could be effectively used to demonstrate frequencies of adverse drug side effects when the risk was greater than 1 percent, and icon-based pictographs for adverse events with a smaller than 1 percent risk, effectively communicating the essential gist of complex information. These display methods are illustrated in figures 1a-1d.
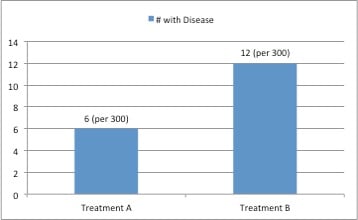
Figure 1a. Differences of relative risk (e.g., conveying that one treatment has increased adverse effects relative to another) can be best displayed in bar charts as in figure 1a, in which the frequencies of disease outcomes for two treatments are indicated.
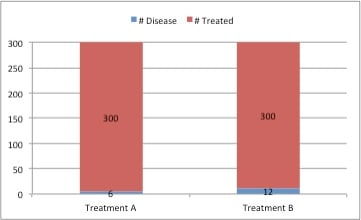
1b. Messages of absolute risk, (e.g., conveying that there is little absolute difference in effectiveness between two treatments) can be displayed using stacked bar charts as in figure 1b, in which the frequencies of disease outcomes are displayed among the total treated.
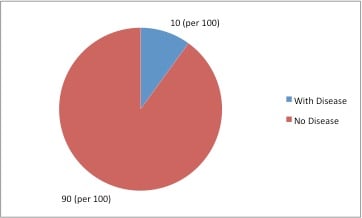
1c. Incidents of adverse events that occur more than 1 percent of the time are effectively communicated through pie charts, as in figure 1c.
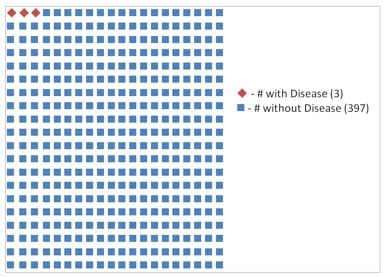
1d. Events that occur less than 1 percent of the time are effectively communicated through icon-based pictographs, as in figure1d.
Remember that even experts are susceptible to reasoning errors. Errors in understanding among medical students, physicians, specialists and subspecialists can cause misjudgment of probabilities of risks and benefit [11-13]. Usually, these errors are not the result of lack of knowledge (specialized medical knowledge) or bad logic [14]. For example, physicians and other health care professionals in one study were asked to predict the likelihood that a patient who tested positive for an unknown disease actually had the disease, given that the disease had a 10 percent base rate in the population and that the test had 80 percent sensitivity and 80 percent specificity, which were defined for them [15]. (Sensitivity is the probability that, if you truly had a disease, you would test positive for it, and specificity is the probability that, given an absence of a disease, you would test negative for it.) Participants merely had to select whether the correct likelihood was closer to 30 percent or 70 percent. Only 31 percent of physicians selected the correct answer, and the group of health care professionals that fared best—public health experts—only scored around chance (55 percent). Moreover, high school students selected the correct answer at roughly the same rate as physicians (33 percent [3]), demonstrating that this sort of processing error is not related to medical expertise. However, the fact that physicians’ judgments were below the level of chance suggest that this was not merely an inability to reason correctly; it appeared to result from a systematic bias. Now that this susceptibility is identified, it can be addressed using verbal and visual communications, as we describe below.
Explain all combinations of test results and disease. The same principle that explains the previous error in interpreting diagnostic tests—that people confuse nested classes such as sensitivity and posttest probability—applies when probabilities must be combined to make diagnostic judgments, as in conjunction (“and”) or disjunction (“or”) judgments. This was illustrated by a study in which physicians were required to make diagnostic judgments of the probability that hypothetical patients had coronary artery disease (CAD), an imminent risk of myocardial infarction (MI), one or the other, or both [12]. The physicians in this group were all vulnerable to disjunction errors (ranging from 20-30 percent of judgments) in which the combined probability that the hypothetical patient had either CAD or imminent risk of MI was judged to be lower than the probability that the hypothetical patient had CAD or risk of MI individually (though specialists were better at discriminating high and low risk based on the hypothetical patient descriptions).
An evidence-based theory of reasoning, fuzzy trace theory, explains this as a result of confusion of overlapping classes, as in the class of having CAD but no risk of MI, of having risk of MI but not having CAD, and of both being at risk of MI and having CAD. Consequently, this is an advanced error that isn’t a reflection of lack of knowledge. Yet, the susceptibility to this error is relevant to clinical practice.
This sort of error can be effectively addressed by using as a visual intervention a 10 × 10 grid in which each square represents a woman with potential illness. The grid demonstrates pretest information such as the base rate chance of the potential diagnoses (e.g., CAD and MI), as well posttest information expected based on the sensitivity and specificity of the diagnostic test [16]. This intervention is illustrated in figure 2. Using this intervention, diagnostic errors in posttest probability estimation were reduced. Moreover, this intervention performed better than the use of Bayesian clinical calculators, despite the participants’ being taught how to use Bayes’ theorem. This contradicts the assumption that calculation of exact numbers should improve health-related judgments [6]. This visual intervention was successful because it represents each class discretely and accounts for all relevant classes, allowing for visual estimation and a reduction of interference from overlapping classes and thus accurate estimation of probability of disease given a positive or negative test result.
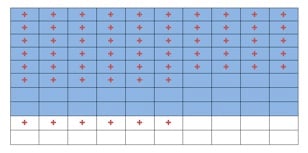
Figure 2. A sample grid indicating all posttest probabilities, indicating a base rate pretest probability of 0.8, a test sensitivity of 0.7, and a test specificity of 0.7. Patients with disease are represented with blue cells, while patients with no disease are represented with white cells. Patients with a positive test are represented with a red +. (Adapted from Lloyd & Reyna [16]).
Using these evidence-based communications methods can improve judgments of risks and benefits of illness and treatment in clinical care. The same principles have been applied in many settings—to reduce unhealthy risk-taking in adolescence, to plan for and mitigate cognitive declines that occur with aging, and to provide a model of vaccination decisions in the proliferation of antivaccination messages, to name a few examples [13, 17, 18]. In all of these settings, informed medical decision making is dependent on communicating an essential bottom line: which option is more likely to provide life rather than death, relief rather than suffering, mobility rather than disability.
These conclusions about communicating health risks and benefits also illustrate that evidence-based theory is critical to designing interventions with practical applications. Relevant cognitive theories should be used to improve risk and benefit communication in relevant medical contexts. Effective communication provides a link between research and good medical outcomes.
Wilhelms EA, Reyna VF. Fuzzy trace theory and medical decisions by minors: Differences in reasoning between adolescents and adults. J Med Philosophy. In press.
Bransford JD, Johnson MK. Contextual prerequisites for understanding: Some investigations of comprehension and recall. J Verbal Learning and Verbal Behav. 1972;11:717-726.
Reyna VF, Mills BA, Estrada SM. Reducing risk taking in adolescence: effectiveness of a gist-based curriculum. Paper presented at the 30th Annual Meeting of the Society of Medical Decision Making; October 2008; Philadelphia, PA.
Fischhoff B, Brewer NT, Downs JS. Communicating risks and benefits: an evidence-based user’s guide. Food and Drug Administration; 2011. http://www.fda.gov/downloads/AboutFDA/ReportsManualsForms/Reports/UCM268069.pdf. Accessed December 11, 2012.
Reyna VF, Lloyd FJ, Brainerd CJ. Memory, development, and rationality: an integrative theory of judgment and decision-making. In: Emerging Perspectives on Judgment and Decision Research. New York: Cambridge University Press; 2003: 201-245.